


Files
Download Full Text (694 KB)
Date of Graduation
5-2026
Description
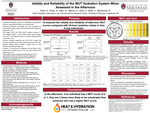
The WUT (weight, urine color, and thirst) Venn diagram is recommended for individuals to self-assess their hydration status. However, current research is limited to comparisons between morning first-void markers and 24-hour markers. PURPOSE: To examine the validity and reliability of afternoon WUT scores in comparison to 24-hour hydration status. METHODS: Fifty participants (25 ± 8y, 72.2 ± 14.9kg) voluntarily participated in this study. Participants collected afternoon spot urine between 2:00 and 4:00 pm and 24-hour urine samples on three out of seven consecutive days. Body mass (BM), urine color (Ucol), urine osmolality (Uosm), urine specific gravity (USG), and thirst perception were measured and recorded for afternoon samples in free-living conditions. Ucol, Uosm, and USG were measured and recorded for 24-hour samples. Spot values for hypohydration were as follows: afternoon USG ≥1.020, body mass loss (BML) > 1%, Ucol > 4, and thirst level > 4. The total number of hypohydration indicators was classified as 0, 1, 2, or 3 to form the WUT score. The sensitivity and specificity of 0, 1, 2, or 3 WUT scores were characterized using Receiver Operating Characteristics (ROC) analysis to calculate the predictive value of WUT in hypohydrated and euhydrated states. A positive likelihood ratio (LR+) provided additional context, indicating predictive capacity of WUT markers, indicating 24-hour Uosm > 500mOsm/L. RESULTS: Among truly hypohydrated participants (urine osmolality greater than 500), WUT scores of 2 and 3 correctly identified 30% of those participants (sensitivity). However, among truly euhydrated participants (urine osmolality < 500), WUT scores of 0 and 1 correctly identified 84% of them (specificity). The positive likelihood ratio of 1.9 and the negative likelihood ratio of 0.83 indicate that a positive WUT score of 2-3 produces only a slight increase in the probability of hypohydration, falling just short of the clinically significant likelihood ratio. Body mass loss decreased across days (day 1: -0.8 ± 1.0%, day 2: -0.7 ± 0.8%, day 3: -0.3 ± 0.8%, p-value: 0.0036), indicating an improvement in fluid balance. Thirst (day 1: 4±1, day 2: 4±2, day 3: 4±2, p-value: 0.6671) and urine color (day 1: 4±1, day 2: 3±1, day 3: 4±2, p-value: 0.0817) were not significantly different across days. The average 24-hour urine osmolality was 564.3 ± 226.7 mOsm/L. CONCLUSION: Our participant hydration reflected a wide range and likely day-to-day variation that blunts sensitivity for afternoon values. This can be attributed to participants maintaining an ad libitum state and to the afternoon samples being influenced by recent fluid intake, exercise, and diet, compared with morning/first void samples. Overall, afternoon WUT values are best used as a screening aid paired with objective measures such as USG or Uosm to inform decisions that affect performance or operations. PRACTICAL APPLICATION: In field settings such as athletics, the military, and occupational settings, the WUT Venn diagram should be used as a screening aid alongside additional scientific measures to reflect overall hydration status accurately.
Publication Date
4-2026
Document Type
Book
Degree Name
Bachelor of Science in Exercise Science
Degree Level
Undergraduate
Department
Health, Human Performance and Recreation
Advisor/Mentor
McDermott, Brendon
Committee Member
Butts, Corey
Disciplines
Health Services Research | Medicine and Health Sciences | Patient Safety
Keywords
WUT; Hydration; Hypohydration; Dehydration; weight; urine; thirst
Citation
Hines, P. A., Perez, R., Allen, R., Wierick, S., Zhao, X., Butts, C., & McDermott, B. (2026). Validity and Reliability of the WUT Hydration System When Assessed in the Afternoon. 2026 Honors Symposium. Retrieved from https://scholarworks.uark.edu/coesym26/12